Data sources
The list of indicators visualized through our dashboard and their data source are listed below.
|
Category |
Socio-Economic Condition Monitored |
# of SDG which it aligns with |
Primary Indicator |
Data source |
|
Living Conditions |
Access to Electricity |
7 |
Percentage of households with access to electricity |
HIES (2016) |
|
Income and Employment |
8 |
Per Capita Income (BDT/Month) |
HIES(2016)
|
|
|
Poverty |
1 |
Percentage of population living below the extreme poverty line |
HIES(2016) |
|
|
Sanitation Facilities |
4 |
Percentage of Households using sanitary latrines/toilets. |
HIES (2016) |
|
|
Source of Drinking Water |
6 |
Percentage of Household using tubewells as source of drinking water in the rural communities |
HIES (2016) |
|
|
Health |
Birth Registration |
16 |
Percentage of registered births |
DHS (2014) |
|
Nutrition |
2 |
Percentage of stunted growth |
DHS (2014) |
|
|
Under 5 Mortality |
3 |
Percentage of children dying after age 5 |
DHS (2014) |
|
|
Education |
Primary Education |
4 |
Primary Education Completion Rate (%) |
BANBEIS (2015) |
|
Infrastructure |
Paved Roads |
9 |
Percentage of Roads that are Paved |
Bangladesh Statistical Yearbook (2018) |
|
Environment |
Reserve forest area |
15 |
Percentage of reserve forest area in the total area of a district |
BBS District Statistics |
|
Disaster Hazard (From floods, tornadoes, earthquakes and floods) |
- |
Natural Disaster Hazard Indicator |
Development of multi hazards map for Bangladesh using GIS technique ( Islam et al. 2017) |
Here is some summarized information about these datasets, while detailed descriptions of the sources can be found in the links provided.
Data Sources Used For the Primary Indicators
|
Data Source |
Full Form (if any) |
URL |
Data Description |
Year |
Periods after Which New Data Is Published |
|
BBS |
Bangladesh Bureau of Statistics |
District Statistics of Bangladesh |
2011 |
Census is conducted after 10 years |
|
|
HIES |
Household Income and Expenditure Survey |
Data to estimate household condition, living standard |
2016 |
Every 5 years |
|
|
World Bank |
World Bank |
Data to estimate poverty condition |
2010 |
Every 5 years |
|
|
DHS |
Demographic and Health Survey |
This data is also similar to HIES which can be used to estimate living condition, health condition, govt. policies etc. |
2014 |
Every 2-3 years |
|
|
BANBEIS |
Bangladesh Bureau of Educational Information and Statistics |
Education related statistics, such as primary completed statistics, secondary completed, dropout rates etc. |
2015 |
Every year from 2009 |
|
|
Bangladesh Statistical Yearbook |
Bangladesh Statistical Yearbook |
A complete summary of different statistics collected from different surveys of different years. |
2018 ( Merging different surveys data from different years) |
Every year |
Aside from the sources mentioned above, a few other indicators were used to provide supporting statistics and visualizations which were deemed relevant for adequately monitoring and understanding the state of Bangladesh and recent trends with respect to the respective socio-economic conditions. Some additional data sources were required for gaining the required data for this other than the sources mentioned above. These sources were as follows
Additional Data Sources Used in the Web Dashboard
|
Data Source |
Type of Data Extracted |
Reference |
|
macrotrends.net |
Unemployment Rate in Bangladesh Over the Years |
|
|
tradingeconomics.com |
Percentage of Population Living under the National Poverty Line in Bangladesh over the years. |
|
|
Literacy Rate in Bangladesh over the years. |
||
|
Real Time Health Information Dashboard |
Under 5 Mortality Rates over the years in Bangladesh |
Disclaimer: Our web dashboard simply summarizes, visualizes and displays the data found in the above sources. We do not check, filter or verify the correctness of the data provided from any of the sources given above. Data and Design Lab will not be responsible for errors in the data of these sources.
Definition list
- Household
- Access to Electricity
- Per capita income (monthly)
- Poverty rate
- Sanitation Facility
- Source of Drinking Water
- Birth Registration
- Percentage of stunted growth
- Under 5 Mortality
- Primary Education Completion (%)
- Infrastructure
- Paved Roads
- Nighttime Light
- Natural disaster hazard indicator
Household
Household is the smallest unit of social institution. Almost all the socio-economic activities are being performed around this unit. It can be defined as a dwelling unit where one or more persons live and eat together under a common cooking arrangement. Matrimonial or blood or both relations, exit among most of the persons who reside in the dwelling.
HIES: 2016, P-145
Access to ElectricityPercentage of households with access to electricity
HIES: 2016, P-26
Per Capita Income (monthly)Per capita income (monthly) is the average of the sum of the earnings of all the household members in cash or in kind at the same period of time.
HIES: 2016, P-146
Per capita domestic factor income (monthly)Factor income is the flow of income that is derived from the factors of production. Per capita domestic factor income was calculated at district at divisional level using HIES 2016 survey data. This was obtained by excluding remittances, government transfers (safety net and stipend) and social income (insurance, lottery, charity) from the total household monthly income.
Poverty rate% of households living below the upper poverty line (HCR)
The head count rate of poverty provides the estimate of the percentage of people living below the poverty line as a share of total population. Head Count Rate (HCR) is computed using CBN Method. There are two poverty line used in Bangladesh-
- Lower poverty line: Food poverty line + Lower non-food allowance
- Upper poverty line: Food poverty line + Upper non-food allowance
A basic food basket of eleven-food items is selected and the quantities in the basket are scaled according to the nutritional requirement of 2122k.cal per person per day. Thus, the cost of acquiring the basket is calculated. This estimated cost is taken as a Food Poverty Line. Food Poverty Line is calculated for 16 geographical strata considering the cost of living & price difference across geographic areas.
Lower Non-food AllowanceThe non-food allowance is estimated by taking the median amount spent for non-food items by a reference group of households whose total per capita expenditure is close to the food poverty line.
Upper Non-food Allowance: The non-food allowance is estimated by taking the median amount spent for non-food items by a reference group of households whose food per capita expenditure is close to the food poverty line.
HIES: 2016, P-55,56,151,152
Sanitation FacilityPercentage of Households using sanitary latrines/toilets.
HIES: 2016, P-23
Source of Drinking WaterPercentage of Household using tube-wells or supplied water as source of drinking water.
HIES: 2016, P-24
HealthBirth Registration
Percentage of de jure children under age 5 who has a birth certificate or child does not have a birth certificate, but his/her birth is registered with the civil authorities.
Bangladesh DHS 2017-18,P-14
Percentage of stunted growth% of children (under age 5) whose height-for-age Z-score is below minus two standard deviations (-2 SD) from the median of the reference population are considered short for their age (stunted). % of children(under age 5) whose Z-score is below minus three standard deviations (-3 SD) from the median are considered severely stunted.
Bangladesh DHS 2017-18,P-178
Under 5 Mortality
The probability of dying between birth and the fifth birthday (deaths per 1000 live births)
Bangladesh DHS 2017-18,P-178
EducationPrimary Education Completion Rate (%)
The percentage of students enrolled at the beginning grade/year of the level of education who finished or graduated from the final grade/year at the end of the required number of years of that level of education.
- BANBEIS provided the percentage of primary dropout rates (D). The completion rate (C) was calculated using C = 100 - D
Where, Drop-out Rate refers to the percentage of students for any reason leaving educational institutions (in any given grade or level) and did not come back to finish the grade or level during that school year to the total number of students enrolled during the previous school year.
Bangladesh Education Statistics 2017,P-23
InfrastructurePaved Roads
Percentage of Roads that are paved (Total road= paved + unpaved)
Statistical Yearbook Bangladesh 2019, P-231
Environment
Natural Disaster Hazard Indicator
HS = 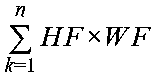
Where, HS: total hazard score, WF: weighting factor, k=1 for arsenic, k=2 for drought, k=3 for earthquake, k=4 for flood, k=5 for cyclone, k=6 for tornado, and k=n (n: total number of disasters) disaster. The “hazard factor” for a particular hazard in a particular district was defined by comparing the district-wide historical disaster database with the corresponding intensity scales and damage risk levels. Hazard factors were considered on a scale from 1 to 3 for arsenic, 1 to 7 for drought, 1 to 8 for earthquake, 1 to 7 for flood and 1 to 8 for cyclone and 1 to 5 for tornado. “Weighting factors” for particular hazards in a particular district were defined based on the frequency of particular disasters in different districts.
Source: Islam et al. 2017. Development of multi hazards map for Bangladesh using GIS technique. IUBAT Review
Rationale for choice of indicators
We identify the indicators that can help the development agencies in gaining a spatial understanding of the socio-economic conditions and stimulate effective decision making. Rather than concentrating only on a single indicator we here consider a set of indicators as it is now established that the effect of socioeconomic factors is much broader than just poverty or income (Adler and Ostrove, 1999; Gornick, 2002; Marmot, et al., 2010). Most of the indicators we identify are included amongst the National Priority Indicators of the United Nations’ Sustainable Development Goal (SDG), while some are additional indicators that may provide useful supplemental information to the decision-makers.
We select the relevant data sources for monitoring these indicators. To identify relevant and usable data sources, we chose sources that contained data that had at least the district level of granularity. It is to be noted here that downsampling from data sources that contain data at higher levels of granularity can increase sampling errors, thereby reducing the feasibility of monitoring these indicators correctly. Making such sources the focal point for decision making is risky.
We had to consider an important aspects traditional data that relates with how recent the data was, and the period after which it will be updated again. Conducting nationwide surveys and generating enough data to capture the condition of the indicators at a subnational level of granularity is costly and time-consuming, many of the traditional data sources are refreshed after considerably long periods, making the data stale in many cases. To address this, we are conducting research on the feasibility of using state-of-the-art computational mechanisms to harness nontraditional heterogeneous data sources, such as the household level energy consumption data, traffic data, sensor data, port and road connectivity data, high volume satellite daytime imagery and nighttime lights to monitor the socio-economic conditions of Bangladesh. The results from our findings on the feasibility of Nighttime Lights were documented in the paper our recent publications and presentations.
We have considered five basic categories of indicators- living standard, health status, education, infrastructure, and environment. In living condition category, we have tried to reflect the economic status of the households living in the district. Living condition is captured by household monthly per capita income, % of people living below the extreme poverty line, access to electricity, access to safe drinking water and sanitation facility. Income and poverty both are widely used indicators for reflecting economic condition. Access to electricity has a robust impact on rural economic development and poverty reduction (Rud, 2012; Peter and Vans, 2011; Khandkar et al. 2012 and 2013; van de Walle et al. 2015). Several studies have found that access to electricity has a positive impact on educational performance, income level, and health (Parikh et al., 2015; Lenz et al., 2017). Access to safe drinking water and improved sanitation facility is also included explicitly in the Sustainable Development Goals (Goal-6). Environmental sustainability and poverty alleviation is closely associated with access to these two facilities. Empirical studies have also suggested that access to improved water and sanitation facility has a positive and significant impact on health, education, income, and wealth (Parikh et al., 2009). Therefore, both the variables are included in the living condition category.
The next category is Health. Health status represents local development and it’s an indicator of human capital. To represent this category, we have included three indicators- infant mortality rate, % of stunted growth, and birth registration. Infant and child mortality rates reflect a country’s level of socioeconomic development and quality of life. The rates are also useful in identifying promising directions for health and nutrition programs in any country (NIRTOP, 2016). Stunted growth rate is also an important indicator of nutritional status and health in populations (WHO, 2006). Birth registration rate is included as it is considered as a necessary indicator for government’s planning of national policies (UNICEF, 2020). Target (16.9) under Goal 16 of the SDGs aims to provide legal identity for all, including birth registration, by 2030. Moreover, Target (16.9) under Goal 16 of the SDGs aims to provide legal identity for all, including birth registration, by 2030.
Similarly, education is a central part of development status as it enhances the earning potential and productivity of the household members and recognized as key determinant of household poverty (Cameron and Cameron, 2006; Rodriguez and Smith, 1994). Education is fundamental to personal empowerment as it helps to reduce inequality and increased political and community participation (Hannum and Buchmann, 2003). In this study, we have considered primary education completion rate to proxy this variable.
Next, to proxy infrastructural development, we have used the percentage of the length of paved road of a district. High quality road facilitates rural poverty alleviation by boosting up agricultural production, reducing price distortion, promoting the local market, employment, school enrollment and expanding domestic trade (Gibson and Olivia, 2010; Wong et al. 2017; Khandaker et al., 2009 and Warr, 2005).
We have also included environmental indicators as development cannot continue if the environment and natural resources deteriorate. Two specific indicators were considered- natural hazard and reserve forest area. Vulnerability to natural disaster is one of the major constraints to alleviating poverty and facilitating economic development (Sawada, 2007; Haen and Hemrich, 2007). Poor people are the most vulnerable to sudden shocks, risks and uncertainty and they also suffer disproportionately from hazards relative to the rich (Varley, 1994; Okuyama, 2004). Disasters like flood and cycle causes destruction of country’s social and physical infrastructure which in turns changes individual’s production and consumption behavior and investment decision (Haque and Jahan, 2015). In this study multi hazard map prepared by Islam (2017) was used. This work constructed multi hazard score based on a combination of observed local hazard intensity, frequency of occurrences and vulnerability. Among the hazards it includes arsenic, earthquake, drought, flood, cycle, tornado.